50 Essential UX Terms Every Designer Should Know
If you’ve ever sat in a meeting and someone dropped “information architecture” or “cognitive load” like everyone should just know what that means — you’re not alone. UX terms can feel like a secret language, and honestly, a lot of people in the industry throw them around without fully understanding them either. This complete UX glossary breaks down 50 essential UX design terms with plain-English definitions and original infographic illustrations for each one. Think of it as your illustrated UX terms guide — whether you’re a beginner trying to get your bearings or a seasoned pro who needs a refresher, these are the UX terms that matter most. These definitions come from my book UX for Cats — a visual, fun, and slightly irreverent take on learning UX vocabulary. The book is designed for visual learners who want to actually remember what these terms mean, not just skim past them. Most of the content is right here on this page, but the print version is a much better reading experience (and way less scrolling). So grab your beverage of choice and let’s get into it. Here are the 50 most important UX design terms you need to know.Table of Contents
Use the links below to jump to any of the 50 UX terms covered in this guide. They’re grouped by topic to help you find what you need fast.Foundational Concepts
- 1. User Experience
- 2. User Interface Design Principles
- 3. User-Centered Design
- 4. Design Thinking
- 5. Information Architecture
Research & User Analysis
- 19. User Persona
- 20. User Journey
- 21. User Flow
- 23. User Feedback
- 24. User Interviews
- 25. User Surveys
- 26. User Stories
- 27. Task Analysis
- 32. User Research
- 34. Empathy
Design & Prototyping
- 7. Prototyping
- 8. Wireframing
- 16. Iterative Design
- 17. Lean UX
- 18. Design System
- 31. Fidelity
- 37. Rapid Prototyping
Visual & Interaction Design
- 10. Visual Design
- 11. Typography
- 12. Color Theory
- 13. Mobile First
- 14. Responsive Design
- 33. Visual Hierarchy
- 40. Interaction Design
Development Methodologies
Usability & Accessibility
Strategic & Analytical
- 28. Key Performance Indicators
- 29. A/B Testing
- 30. Consistency
- 35. User Engagement
- 39. Content Strategy
- 42. Navigation
- 43. Above/Below the Fold
- 44. Gamification
- 45. Ethical Design
- 46. Data-driven Design
- 47. Conversion Rate
- 48. Click-through Rate (CTR)
- 49. Competitor Analysis
- 50. Information Visualization
1. User Experience
 User Experience, or UX, pertains to the entire experience a user has while interacting with a product or service, usually in relation to how easy or pleasurable it is to use. It includes aspects such as design, layout, text, and interaction elements. The concept of UX is end to end, reflecting a user’s overall perception of a product’s usability and ultimate worth — a concept first popularized by Don Norman at the Nielsen Norman Group.
 2. User Interface Design Principles
 User Interface Design Principles are rules and guidelines, as part of an overall process, that designers follow to create user interfaces (UI) in software or computerized devices, with a focus on usability, aesthetics, and style. These principles guide the design of digital assets like websites and apps, ensuring they are intuitive and user-friendly. They provide guidance on managing user’s actions, also including how to display information, handling different screen sizes, and accessibility.
 3. User-Centered Design
 User-Centered Design refers to a design philosophy and process that places the needs, wants, desires, and even limitations of end users of a product at the forefront during each stage of the design process. This approach involves testing and refining the product over many cycles based on user feedback. The goal of User-Centered Design is to ensure that the final product is tailor-made to suit user needs.
 4. Design Thinking
 Design Thinking is an innovative, user-centric approach to problem-solving that involves understanding user needs, challenging assumptions, and redefining problems to identify alternative solutions not instantly apparent. Originally championed by IDEO, this iterative process involves empathy, definition, ideation, prototyping, and testing stages, fostering a deep understanding of the user and the problem at hand. It’s a vital strategy in the business environment to drive innovative solutions and competitive advantage.
 5. Information Architecture
 Information Architecture (IA) is the science of organizing and structuring information in products and services to support usability and findability. It involves creating a structured layout of information and defining how users interact with and navigate through a product. Good information architecture makes it easier for users to understand where they are in a system and where the information they want is located.
6. Usability Testing
 Usability Testing is a method used in user-centered design that evaluates a product’s efficiency, effectiveness, and satisfaction by having real users interact with it. As outlined by the Nielsen Norman Group’s usability testing guide, the process helps identify usability problems, gather qualitative and quantitative data, and gauge user satisfaction to enable product improvements. From a business perspective, usability testing can help minimize development costs, increase user satisfaction, and boost sales by making the product more user-friendly.
 7. Prototyping
 Prototyping is the creation of a preliminary model or release of a product to test its functionality, design, and usability. It’s a critical stage in the design process, allowing for validation of ideas, identification of design flaws, and iterative improvements. In a business context, prototyping minimizes development costs and risks by allowing potential flaws to be addressed before the final product is built.
 8. Wireframing
 Wireframing is a process to create a simple sketch or layout of a webpage or app to illustrate the basic structure and components of a page. Tools like Figma make it easy to create wireframes in the early stages of design before visual design and content is added. It helps designers and clients visualize the layout, navigation, and overall function of a site or app without having to worry about a specific design or style too early in the process.
 9. Cognitive Load
 Cognitive Load refers to the total amount of mental effort being used in the working memory, a concept rooted in John Sweller’s cognitive load theory. In design, cognitive load is significant because if a user interface is too complex, it will overload the user’s mental capacity, making it difficult for the user to navigate the system. Designers aim to minimize cognitive load, or the “signal to noise” ratio, to make products more user-friendly.
 10. Visual Design
 Visual Design refers to the aesthetics of a product and how it improves user experience by organizing all the elements and data in a design in a way that is pleasing to the eye. It draws heavily on Gestalt principles and involves the use of colors, shapes, images, typography, and form to enhance usability and improve user experience. A well-designed product can guide users through a system and influence their feelings towards the product.
 11. Typography
 Typography is the art and technique of arranging type to make written language legible, understandable, and appealing when displayed. It involves the selection of typefaces, point size, line length, line-spacing, letter-spacing and other factors. Good typography can influence the reader’s mood, cognitive load, and perception of the content in a positive way that leads to a good user experience.
 12. Color Theory
 Color Theory is a set of principles used by designers to choose, combine, and apply colors. It’s a vital part of visual design, helping to communicate messages, evoke emotions, and guide users through an interface. Understanding color theory can help designers create visually pleasing and effective designs while also being inclusive of users who may have disabilities.
 Yo, Font-Addict! Grab 350+ font combinations for web and print — in print from Amazon or ebook (40% OFF) from Gumroad. You know you want to!

13. Mobile First
 Mobile First Design is a design strategy — first articulated by Luke Wroblewski — that starts by designing for the smallest screen sizes and progressively enhancing the design for larger screens. The approach is based on the idea that it’s easier to scale a design up for a desktop than to simplify a desktop design for mobile. Mobile First Design ensures that the site is accessible and provides a good user experience on mobile devices, which are increasingly the primary device for internet access.
 14. Responsive Design
 Responsive Web Design is an approach to web design — coined by Ethan Marcotte in 2010 — that makes web pages render well on a variety of devices and window or screen sizes by changing their layout and content. It aims to provide optimal viewing and interaction experience—easy reading and navigation with a minimum of resizing, panning, and scrolling—across a wide range of devices. This approach is essential in a time when mobile devices are commonly used as many user’s primary access to the web.
 15. Agile Development
 Agile Development is a methodology for software development that emphasizes flexibility, collaboration, customer satisfaction, and rapid delivery that demonstrates value as early in the process as possible. Rooted in the principles of the Agile Manifesto, it involves regular reflection and adjustment in response to changes and customer feedback through the design and development processes. This approach allows for a more flexible and adaptive development process as opposed to traditional “waterfall” approaches that make dealing with changes much harder.
 16. Iterative Design
 Iterative Design is a design approach that involves a cyclical process of prototyping, testing, analyzing, and refining a product, with the aim of learning and enhancing the product through each cycle. This method allows for the incorporation of user feedback into the design process continuously as it comes up. Iterative Design can result in a better product fit, reduced development costs, and increased customer satisfaction by allowing continuous improvement and alignment with customer needs.
 17. Lean UX
 Lean UX is a design philosophy that seeks to streamline the UX design process by minimizing extensive documentation and maximizing focus on creating the user experience. This methodology encourages quick, iterative design cycles, emphasizing user feedback and making adjustments accordingly. Lean UX facilitates faster time to market, reduces waste, and ensures a stronger alignment with user needs than other methods that value process over the customer.
 18. Design System
 A Design System is a collection of standards, components, and principles that are used to guide the creation and iteration of a product. It includes style guides, patterns, code components, and other elements that help designers ensure consistency across different parts of a product. By adhering to a Design System, designers can create more consistent, cohesive products quickly, as it significantly reduces the guesswork associated with design choices that would otherwise require arbitrary consideration.
 19. User Persona
 A User Persona is a fictional character created to represent a user type that will use a site, brand, or product in a particular way. This character is based on research and includes details like demographics, behavior patterns, motivations, and goals. Designers use personas to try to predict how potential users will interact with a product, and tailor their design solutions for them.
 20. User Journey
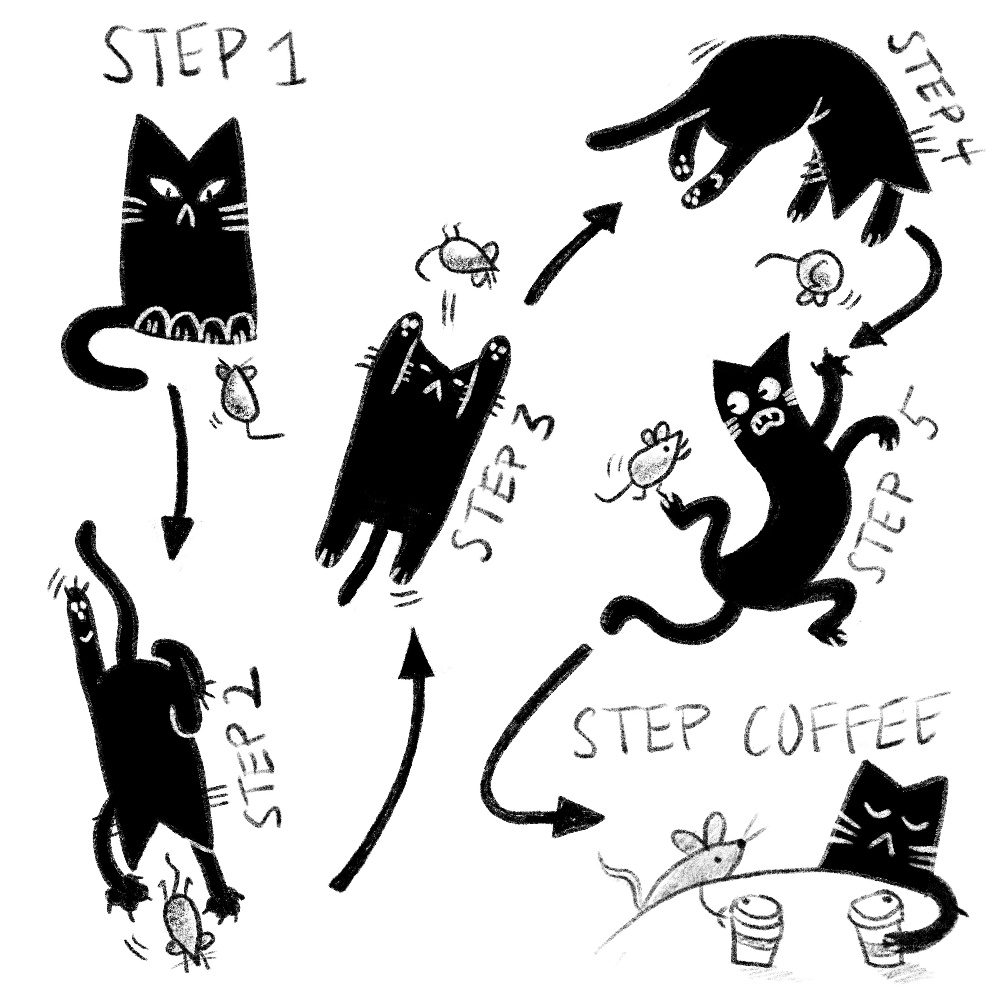
 A User Journey is a series of steps that represent a user’s interactions with a product. It visualizes a user’s path through a product, from initial contact through the process of engagement and into a long-term relationship. Understanding the user journey can help designers create a product that meets user needs and expectations.
 21. User Flow
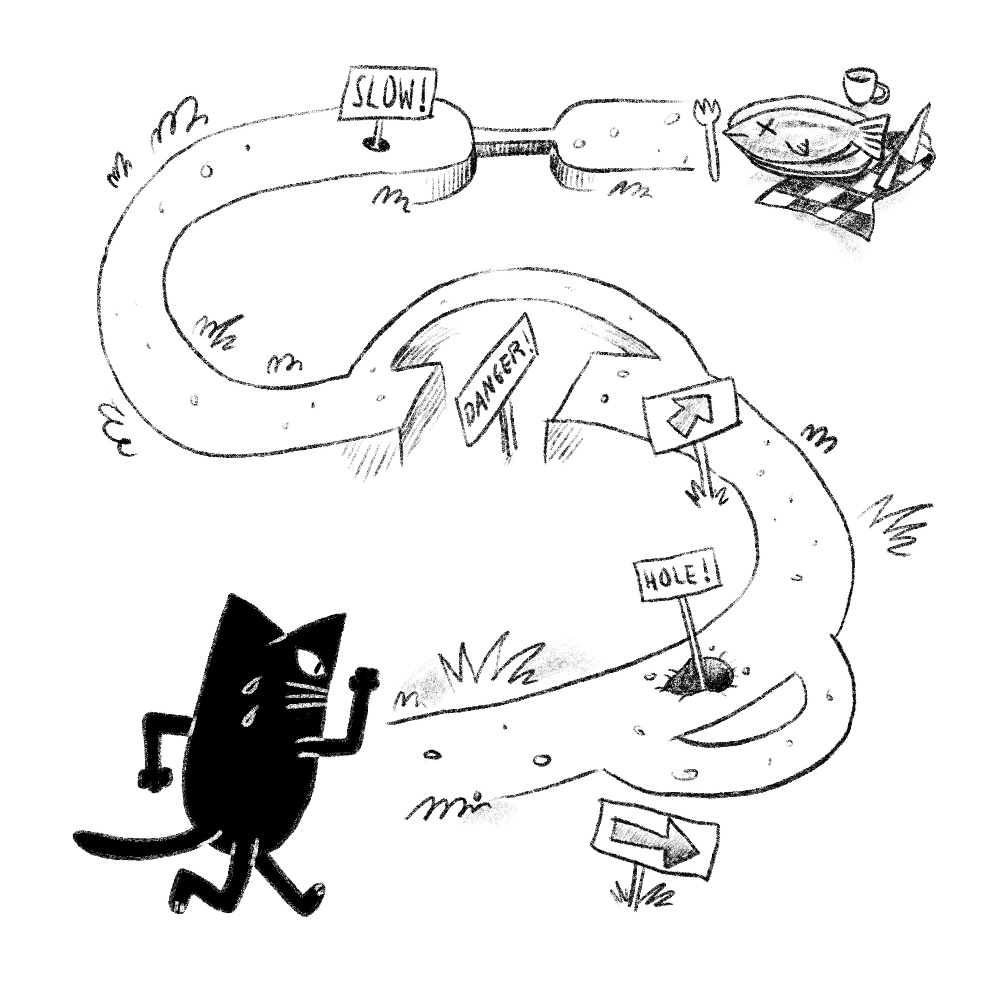
 User Flow is a visual representation of the path a user follows through an interface to achieve a goal. It includes all the different paths and touchpoints a user interacts with. Understanding the user flow can help designers identify potential issues and improve the overall user experience.
 22. Accessibility
 Accessibility in design refers to creating products, devices, services, or environments that are usable by all people, regardless of their abilities or disabilities. As defined by the W3C Web Accessibility Initiative, it ensures that all users, including those with disabilities, have an equal opportunity to interact with and benefit from a product or service. Accessibility can lead to a larger user base and a more inclusive product.
 23. User Feedback
 User Feedback is information provided by users about their experience with a product or service. It can be collected through surveys, interviews, usability testing, and more. This feedback is crucial for understanding user needs, improving products, and enhancing the overall user experience.
 24. User Interviews
 User Interviews are a research method used in design to gain insights into users’ needs, behaviors, experiences, and motivations. They involve a structured conversation with users, where they are asked about their experiences and perspectives on the product or service. User Interviews help designers to understand their audience and create more effective designs.
 25. User Surveys
 User Surveys are a research tool used to gather feedback from users about a product or service. They are usually made up of a series of questions and can be conducted online, in-person, or over the phone. Surveys help to collect user opinions, understand user behavior, and improve the overall product based on the feedback received.
 26. User Stories
 User Stories are a tool used in Agile software development to capture a description of a software feature from an end-user perspective. They help the team understand the value of the feature and how it will be used. User Stories are typically written in the format: ‘As a [type of user], I want [an action] so that [a benefit or value]’.
 Yo, Font-Addict! Grab 350+ font combinations for web and print — in print from Amazon or ebook (40% OFF) from Gumroad. You know you want to!
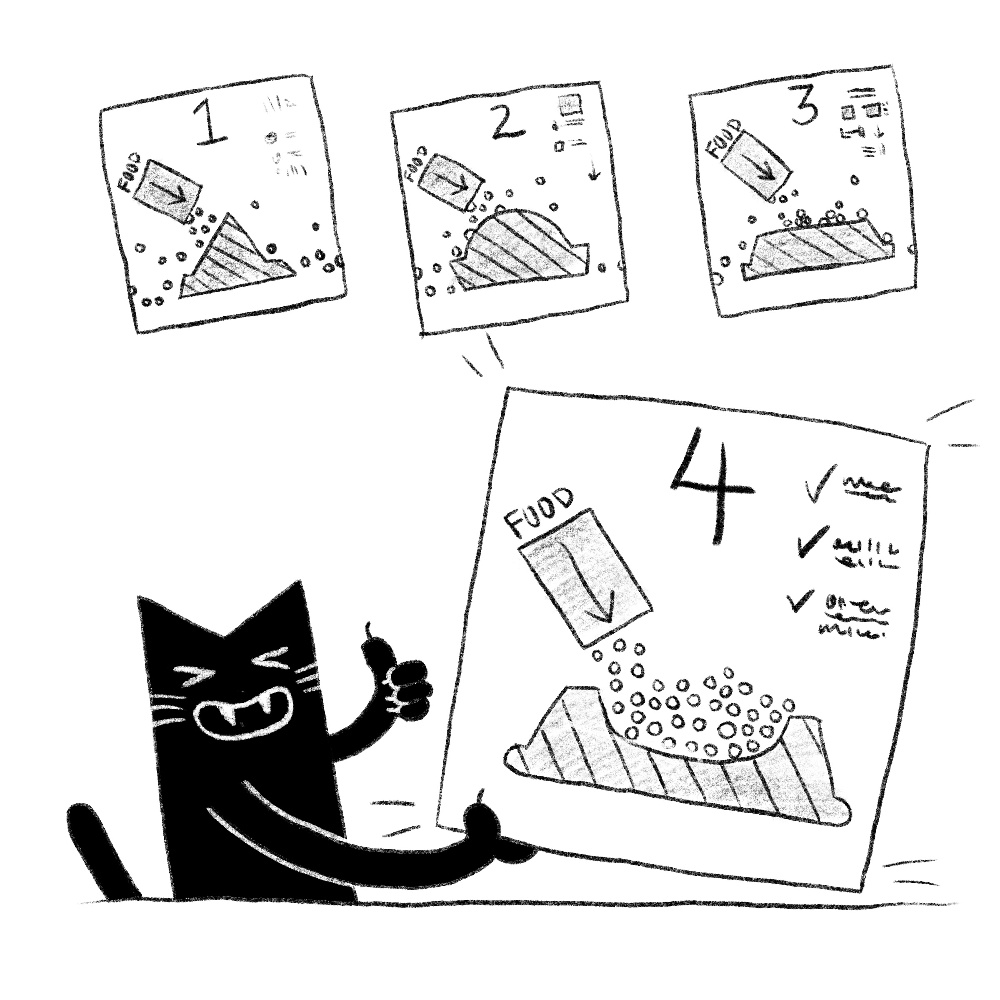
27. Task Analysis
 Task Analysis is the process of breaking down a task into its smaller steps to understand how users perform it. It’s used to identify potential problems, understand user behavior, and design more effective and user-friendly products. Task Analysis can lead to more intuitive interfaces and improved user satisfaction.
 28. Key Performance Indicators
 Key Performance Indicators (KPIs) are measurable values that demonstrate how effectively a company is achieving key business objectives. They help organizations track their progress and measure their performance against their goals. Understanding and tracking KPIs can help companies focus on what’s important and make better decisions.
 29. A/B Testing
 A/B testing, as Optimizely defines it, is a method of comparing two versions of a webpage or other product to see which one performs better. It involves showing the two variants to similar visitors at the same time and comparing which variant drives more conversions. A/B testing can help designers and developers make more informed decisions and create more effective products.
 30. Consistency
 Consistency in design refers to the uniformity of design elements and user experience across a product or platform. This includes maintaining uniformity in typography, color schemes, imagery, and interface responses to user interaction. From a business standpoint, design consistency enhances user learnability, usability, and trust, contributing to improved user satisfaction and brand perception.
 31. Fidelity
 In design, fidelity refers to the level of detail and functionality in a design representation, such as a prototype. Low-fidelity designs are more basic and focus on functionality and structure, while high-fidelity designs are more detailed and closely resemble the final product. Different levels of fidelity can be used at different stages of the design process to test and improve the design.
 32. User Research
 User Research is the process of understanding user behaviors, needs, and motivations through observation techniques, task analysis, and other feedback methodologies. This understanding can help to create products that are more aligned with user needs and expectations. User Research is a crucial part of the design process that can lead to better products and higher user satisfaction.
 33. Visual Hierarchy
 Visual Hierarchy in design refers to the arrangement or presentation of elements in a way that implies importance. It guides the eye to move in a certain order or pattern, influencing the order in which information is perceived. Visual Hierarchy can make designs more understandable and can guide users to take desired actions.
 34. Empathy
 Empathy in design is the practice of understanding and sharing the feelings of users. It involves putting yourself in the user’s shoes to understand their experiences, needs, and perspectives. Designing with empathy can lead to more inclusive, user-friendly products that meet the needs of a wide range of users.
 35. User Engagement
 User Engagement refers to the quality of the user’s interaction with a product or service. High engagement means the user finds the product valuable, easy to use, and enjoyable, leading to repeated use. User Engagement is a key metric for understanding the success of a product or service.
 36. Error Prevention
 Error Prevention in design refers to the techniques used to prevent user errors before they occur. It’s one of Jakob Nielsen’s 10 usability heuristics and can include clear instructions, confirmation messages before critical actions, and intuitive design. Preventing errors can lead to a more user-friendly and efficient product, improving overall user satisfaction.
 37. Rapid Prototyping
 Rapid Prototyping is a design process where prototypes are quickly created and tested for functionality, performance, and feedback. It’s a cycle of designing, prototyping, and testing, allowing for quick iterations based on feedback. Rapid Prototyping can save time and resources and lead to a better final product.
 38. Usability Guidelines
 Usability Guidelines are best practices that help design teams create products that are easy to use. They include principles such as consistency, simplicity, and clear communication. Following these guidelines can lead to more user-friendly products, higher user satisfaction, and potentially increased adoption rates.
 39. Content Strategy
 Content Strategy involves planning, creating, delivering, and managing content. It’s about ensuring that the right content reaches the right user at the right time. A good content strategy can improve user engagement, increase conversions, and help build a strong brand.
 40. Interaction Design
 Interaction Design, or IxD, is the design of the interaction between users and products. It involves creating intuitive and efficient interfaces that enable users to achieve their goals. Good Interaction Design can make a product easier to use, more enjoyable, and can lead to higher user satisfaction.
 Yo, Font-Addict! Grab 350+ font combinations for web and print — in print from Amazon or ebook (40% OFF) from Gumroad. You know you want to!
41. Inclusive Design
 Inclusive Design is the process of designing products that are accessible and usable by as many people as possible, regardless of their age, gender, ability, or status. Microsoft’s Inclusive Design toolkit is one of the best resources for this approach. It aims to create products that do not exclude anyone and respects diversity among users. Inclusive Design can lead to more accessible products and a larger potential user base.
 42. Navigation
 Navigation refers to the design elements that guide users through a product, like a website or app. Good navigation helps users find the information they need quickly and easily. Effective navigation can improve the user experience and increase user satisfaction.
 43. Above/Below the Fold
 Above the fold refers to the portion of a webpage that’s visible without scrolling, while below the fold is the portion that’s only visible once you scroll down. These terms come from newspaper design and are used in web design to help prioritize the placement of important content. Content above the fold is generally seen as more valuable because it’s the first thing users see.
 44. Gamification
 Gamification involves applying game design elements in non-game contexts, like a website or app. It’s used to motivate participation, engagement, and loyalty. Gamification can make an experience more enjoyable, can increase user engagement, and can lead to more user loyalty.
 45. Ethical Design
 Ethical Design refers to the practice of designing products that respect the rights and wellbeing of users. It includes respecting user privacy, being transparent about data usage, and creating inclusive products. Ethical Design can build trust with users and protect the reputation of a company.
 46. Data-driven Design
 Data-driven Design is a design approach that uses data collected from users to inform design decisions. This can include data on user behavior, preferences, and feedback. Data-driven Design can lead to more effective and user-friendly products, as design decisions are based on actual user data.
 47. Conversion Rate
 Conversion Rate is the percentage of users who complete a desired action on a website or app, like making a purchase or signing up for a newsletter. It’s a key metric for measuring the success of a website or marketing campaign. A high conversion rate means a product or campaign is effective at getting users to take the desired action.
 48. Click-through Rate (CTR)
 Click-through Rate (CTR) is the ratio of users who click on a specific link to the number of total users who view a page, email, or advertisement. It’s a common metric used to measure the success of an online advertising campaign. A higher CTR indicates a more successful campaign.
 49. Competitor Analysis
 Competitor Analysis refers to the process of evaluating the products, strategies, and strengths and weaknesses of business rivals. It serves to understand the market landscape, identify opportunities, and inform strategic decisions. In a business context, Competitor Analysis can furnish valuable insights, enabling strategic positioning and better-informed business decisions.
 50. Information Visualization
 Information Visualization is the use of visual elements like charts, graphs, and maps to represent information and data. It makes complex data understandable, and can help identify patterns, trends, and insights. Effective Information Visualization can make information more accessible, support decision-making, and improve understanding.
 Yo, Font-Addict! Grab 350+ font combinations for web and print — in print from Amazon or ebook (40% OFF) from Gumroad. You know you want to!